15. SciPy样条插值spline和pchip
样条插值法是一种以可变样条来作出一条经过一系列点的光滑曲线的数学方法。插值样条是由一些多项式组成的,每一个多项式都是由相邻的两个数据点决定的,这样,任意的两个相邻的多项式以及它们的导数(不包括仇阶导数)在连接点处都是连续的。 连接点的光滑与连续是样条插值和前边分段多项式插值的主要区别。
15.1 SciPy的样条插值函数
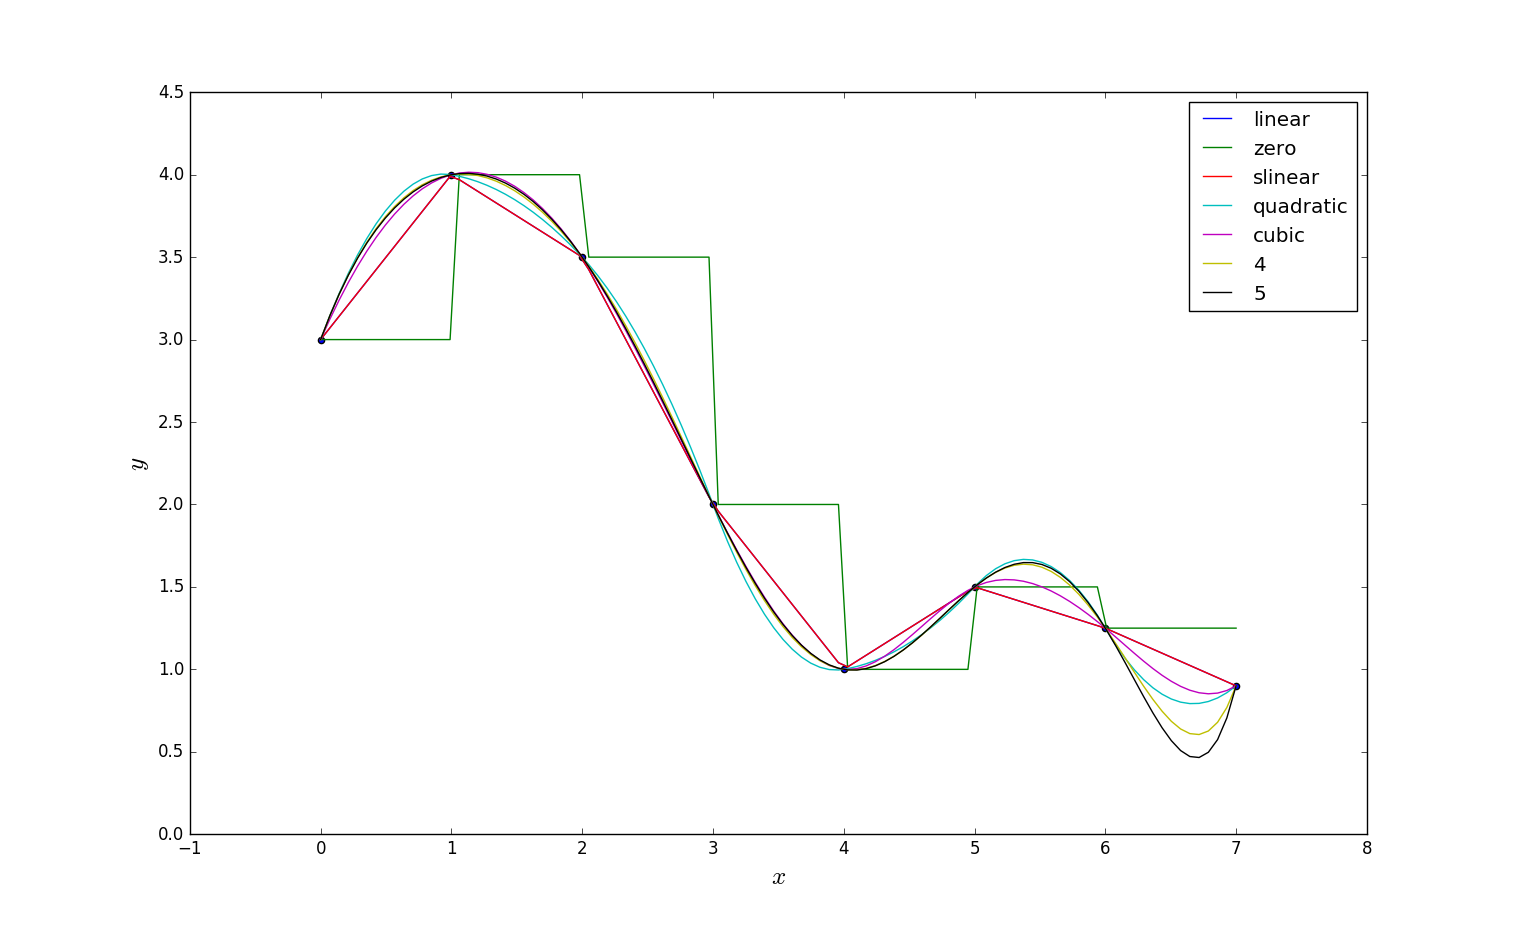
在Scipy里可以用scipy.interpolate模块下的interp1d函数 实现样条插值。 SciPy的0.14.0版本里样条插值方式有:'linear','zero', 'slinear', 'quadratic'(2次), 'cubic'(3次), 4, 5等,可以通过程序对比一下各种样式kind实现的样条插值的差异。
import scipy.interpolate
import numpy as np, matplotlib.pyplot as plt
from scipy.interpolate import interp1d
x= np.array([0, 1, 2, 3, 4, 5, 6, 7])
y= np.array([3, 4, 3.5, 2, 1, 1.5, 1.25, 0.9])
xx = np.linspace(x.min(), x.max(), 100)
fig, ax = plt.subplots(figsize=(8, 4))
ax.scatter(x, y)
for n in ['linear','zero', 'slinear', 'quadratic', 'cubic',  4, 5]:
    f = interp1d(x, y, kind = n)
    ax.plot(xx, f(xx), label= n)
ax.legend()
ax.set_ylabel(r"$y$", fontsize=18)
ax.set_xlabel(r"$x$", fontsize=18)
plt.show()
程序可视化执行结果如下所示:
15.2 复杂点儿的样条插值
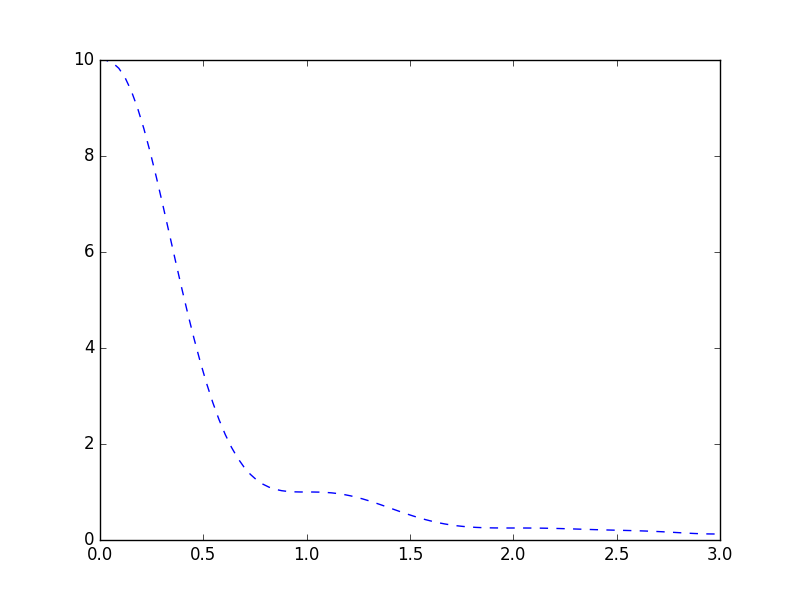
下面的程序有三部分,第一部分是一种特殊的插值KroghInterpolator,有关KroghInterpolator插值可以参阅scipy.interpolate.KroghInterpolator页面下的例子说明。第一部分得到的可视化结果如下所示:
#coding:utf-8
import scipy.interpolate
import numpy as np, matplotlib.pyplot as plt
from scipy.interpolate import interp1d
from scipy.interpolate import KroghInterpolator
#第一部分
g = KroghInterpolator([0,0,0,1,1,1,2,2,2,3,3,3], [10,0,0,1,0,0,0.25,0,0,0.125,0,0])
def f(t):
    return np.log1p(g(t))
plt.plot(x, g(x), 'b--', label='KroghInterpolator')
plt.show()
#第二部分
splines = ['linear','zero', 'slinear', 'quadratic', 'cubic',  4, 5]
x = np.linspace(0,3,100)
nodes = np.linspace(0,3,11)
plt.figure(figsize=(16,8))

for k in xrange(6):
    interpolant = interp1d(nodes, f(nodes), kind = splines[k])
    plt.subplot(2,3,k+1, aspect='equal')
    plt.plot(nodes, f(nodes), 'ro')
    plt.plot(x, f(x), 'r-', label='original')
    plt.plot(x, interpolant(x), 'b--', label='interpolation')
    plt.title('{0} spline'.format(splines[k]))
    plt.legend()
plt.show()
#第三部分
from scipy.interpolate import PchipInterpolator
interpolant = PchipInterpolator(nodes, f(nodes))
plt.figure()
plt.plot(nodes, f(nodes), 'ro')
plt.plot(x, f(x), 'r-', label='original')
plt.plot(x, interpolant(x), 'b--', label='interpolation')
plt.title('PCHIP interpolation')
plt.legend()
plt.show()
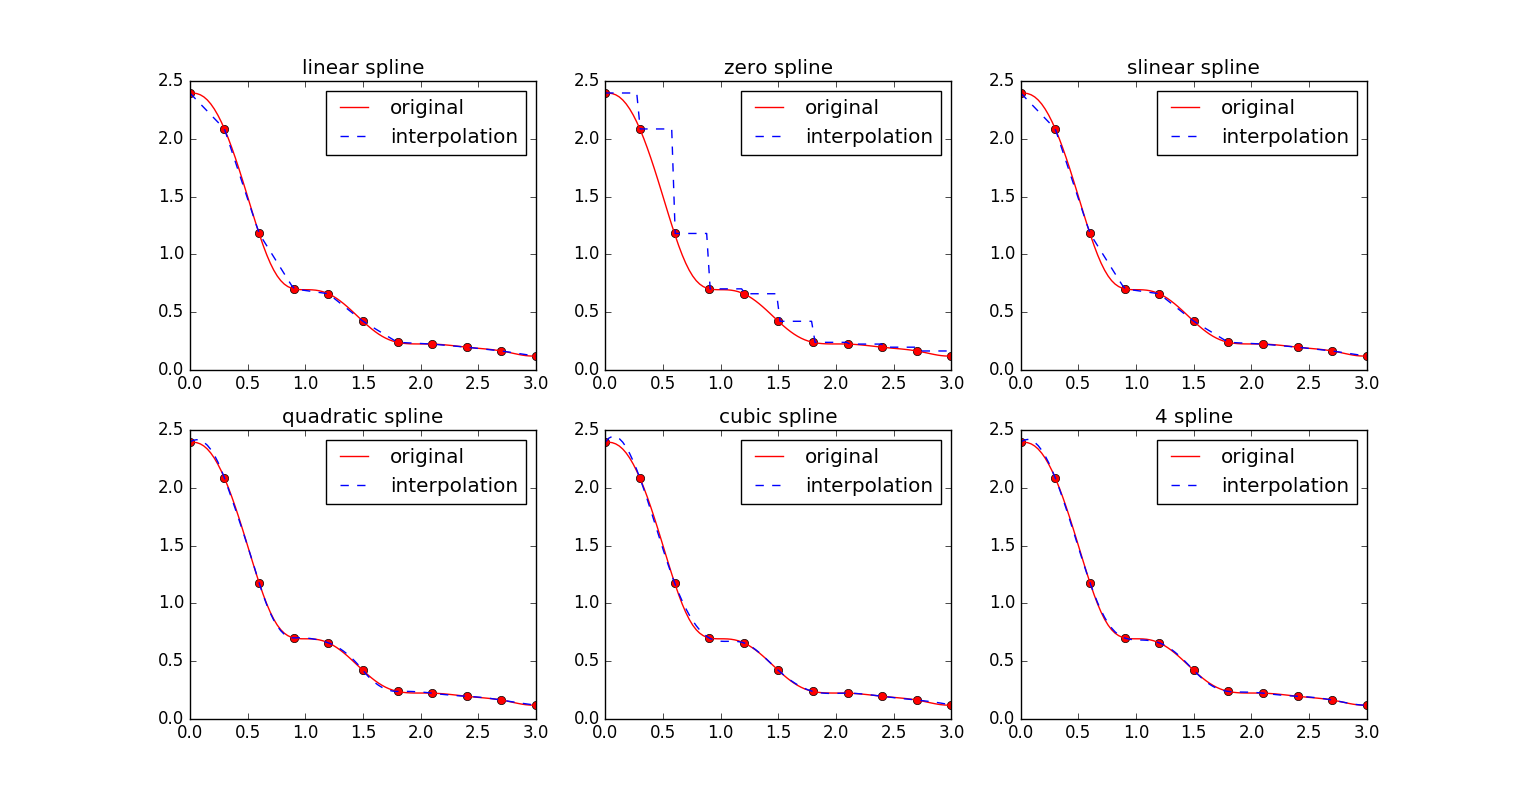
第二部分是对nodes点集进行样条插值使用了各种的插值样式'linear','zero', 'slinear', 'quadratic'(2次), 'cubic'(3次), 4, 5等,得到第二部分得到的可视化结果如下所示:
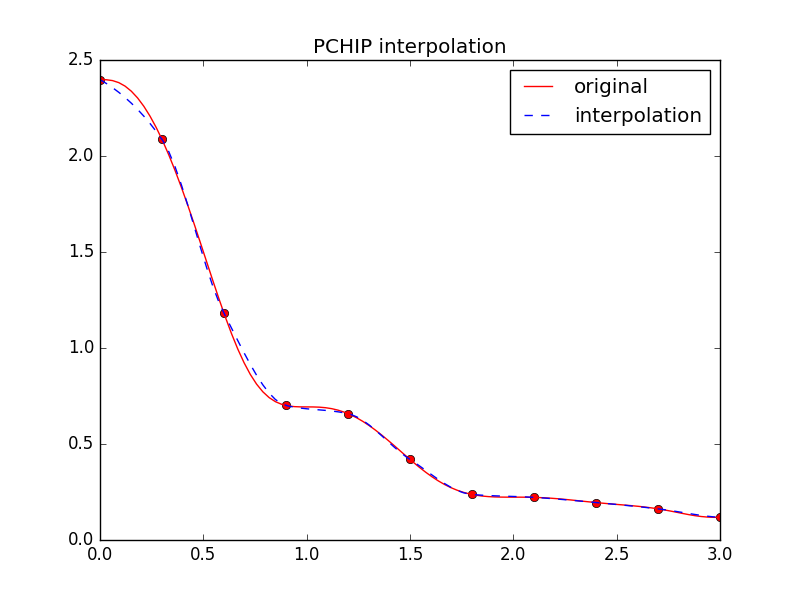
 而第三部分实现的是piecewise monotonic cubic Hermite interpolation(PCHIP)方法,原因是 interp1d三次样条在相邻的节点上并不保证单调性,而PCHIP则可以保证三次样条局部单调性。第三部分得到的可视化结果如下所示: