39. Pandas的时间序列数据-resample重采样
在pandas里对时序的频率的调整称之重新采样,即从一个时频调整为另一个时频的操作,可以借助resample的函数来完成。有upsampling和downsampling(高频变低频)两种。resample后的数据类型有类似'groupby'的接口函数可以调用得到相关数据信息。时序数据经resample后返回Resamper Object,而Resampler 是定义在pandas.core.resample模块里的一个类,可以通过dir查看该类的一些接口函数。
liao@liao:~/md$ python
Python 2.7.12 (default, Nov 12 2018, 14:36:49)
[GCC 5.4.0 20160609] on linux2
Type "help", "copyright", "credits" or "license" for more information.

>>> import pandas.core.resample as pcr
>>> dir(pcr.Resampler)
['__bytes__', ......, '_wrap_result', 'agg', 'aggregate', 'apply', 'asfreq', 'ax', 'backfill', 'bfill', 'count', 'ffill', 'fillna', 'first', 'get_group', 'groups', 'indices', 'interpolate', 'last', 'max', 'mean', 'median', 'min', 'ndim', 'nearest', 'ngroups', 'nunique', 'obj', 'ohlc', 'pad', 'pipe', 'plot', 'prod', 'sem', 'size', 'std', 'sum', 'transform', 'var']
可以看出有mean、pad、ohlc、std、fisrt、fillna等接口函数可以对resample后的数据进行处理
39.1 downsampling 下(降)采用处理
以高频时间序列变低频时间粒度变大数据聚合,原来有100个时间点,假设变为低频的10个点,那么会将原数据每10个数据组成一组(bucket),原来是100个时间点,100个数据,现在是10个时间点,应该有10个数据,那么这10个数据应该是什么呢?可以对每组里的数据的均值mean,或组里的第一个值first、或最后一个last,最为重采样后的数据来进行下一步处理或....。这就是要借助resample后的数据类型调用相应的接口函数来取得。 由于resample函数的参数众多,较为难理解,现在先做一个时序,如下图所示:
import numpy as np
import pandas as pd
c = 21
v = np.arange(1, c)
tx = pd.Series(v)
tx.index = pd.date_range('2018-12-01', periods = 20, freq = "d")
print "tx", "-" * 20, "\n", tx
程序执行结果:
tx --------------------
2018-12-01     1
2018-12-02     2
2018-12-03     3
2018-12-04     4
2018-12-05     5
2018-12-06     6
2018-12-07     7
2018-12-08     8
2018-12-09     9
2018-12-10    10
2018-12-11    11
2018-12-12    12
2018-12-13    13
2018-12-14    14
2018-12-15    15
2018-12-16    16
2018-12-17    17
2018-12-18    18
2018-12-19    19
2018-12-20    20
Freq: D, dtype: int64
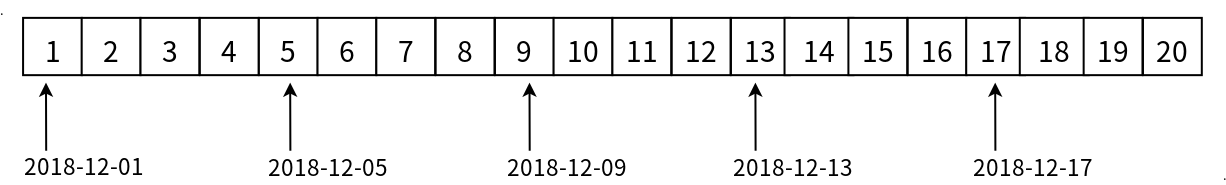
程序的执行结果和图是一一对应的,即2018-12-01的数据为1。
好,现在对tx这个时序进行降采样,每4天为一个组进行分段segment,那么可以这样去分组(用数学的区域概念来描述)
- [2018-12-01,2018-12-05)为第一组,这样
2018-12-01可以落在这个区间里, - [2018-12-05, 2018-12-09)为第二组,
- [2018-12-09,2018-12-13)为第三组,
- [2018-12-13,2018-12-17)为第四组,
- [2018-12-17,2018-12-21)为第五组,第五组的日期2018-12-21尽管不在数据里,可以补齐。这样分组的特点的是左闭右开。
当然,也可采用左开右闭的区间描述这几个分组:
- (2018-11-27,2018-12-01]是第一分组,是为了让第一个时间
2018-12-01能落在第一个左开右闭的分组, - (2018-12-01, 2010-12-05]为第二组,
- (2018-12-05, 2010-12-09]为第三组,
- (2018-12-09, 2010-12-013]为第四组,
- (2018-12-13, 2010-12-17]为第五组,
- (2018-12-17, 2010-12-21]为第六组。 这里,多出来的一组是因为第一时间点要落在第一分组里的要求。
import numpy as np
import pandas as pd

v = np.arange(1, 21)
tx = pd.Series(v)
tx.index = pd.date_range('2018-12-01', periods = 20, freq = "d")
print "tx", "-" * 20, "\n", tx
tf = tx.resample("4d").sum()
print "tf closed using default", "-" * 5, "\n",tf
tf = tx.resample("4d", closed = "left").sum()
print "tf closed = 'left'     ", "-" * 5, "\n",tf
tf = tx.resample("4d", closed = "right").sum()
print "tf closed = 'right'    ", "-" * 5, "\n",tf
程序结果:
tx --------------------
2018-12-01     1
2018-12-02     2
....<省略>....
2018-12-19    19
2018-12-20    20
Freq: D, dtype: int64
tf closed using default -----
2018-12-01    10
2018-12-05    26
2018-12-09    42
2018-12-13    58
2018-12-17    74
dtype: int64
tf closed = 'left'      -----
2018-12-01    10
2018-12-05    26
2018-12-09    42
2018-12-13    58
2018-12-17    74
dtype: int64
tf closed = 'right'     -----
2018-11-27     1
2018-12-01    14
2018-12-05    30
2018-12-09    46
2018-12-13    62
2018-12-17    57
dtype: int64
从语句
tf = tx.resample("4d").sum()
print "tf closed using default", "-" * 5, "\n",tf
tf = tx.resample("4d", closed = "left").sum()
print "tf closed = 'left'     ", "-" * 5, "\n",tf
的输出结果可以看出,resample函数默认closed参数值为left,即左闭右开。所以2018-12-01的输出值10 = 1 + 2 + 3 + 4。2018-12-02的输出值26 = 5 + 6 + 7 + 8。而当resample采用左开右闭时,第一区间里就只有2018-12-01这一天的数据据,所以和为1,奇怪的是第一项数据输出的index不是2018-12-01而是2018-11-27,而第二项输出的index却是2018-12-01,这是为什么?这里得看resample的第二个令人费解的参数label了,label参数是指输出时使用index是用区间的左界值还是右界值呢?例如(a, b]或[a, b)是用左界值a还右边界值b?
import numpy as np
import pandas as pd

v = np.arange(1, 21)
tx = pd.Series(v)
tx.index = pd.date_range('2018-12-01', periods = 20, freq = "d")
print "tx", "-" * 20, "\n", tx
tf = tx.resample("4d").sum()
print "tf closed using default", "-" * 5, "\n",tf
tf = tx.resample("4d", closed = "left").sum()
print "tf closed = 'left'     ", "-" * 5, "\n",tf
tf = tx.resample("4d", closed = "right").sum()
print "tf closed = 'right'    ", "-" * 5, "\n",tf
tf = tx.resample("4d", closed = "right", label = "right").sum()
print "tf closed = 'right' label = 'right'", "-" * 0, "\n",tf
程序执行结果:
tx --------------------
2018-12-01     1
....<省略>....
2018-12-20    20
Freq: D, dtype: int64
tf closed using default -----
2018-12-01    10
2018-12-05    26
2018-12-09    42
2018-12-13    58
2018-12-17    74
dtype: int64
tf closed = 'left'      -----
2018-12-01    10
2018-12-05    26
2018-12-09    42
2018-12-13    58
2018-12-17    74
dtype: int64
tf closed = 'right'     -----
2018-11-27     1
2018-12-01    14
2018-12-05    30
2018-12-09    46
2018-12-13    62
2018-12-17    57
dtype: int64
tf closed = 'right' label = 'right'
2018-12-01     1
2018-12-05    14
2018-12-09    30
2018-12-13    46
2018-12-17    62
2018-12-21    57
dtype: int64
从语句
tf = tx.resample("4d", closed = "right", label = "right").sum()
print "tf closed = 'right' label = 'right'", "-" * 0, "\n",tf
的输出结果可以看到,第一项输出的index已经变成了2018-12-01了,求和为1,也是正确的,第二项2018-12-05的value为14即14 = 2 + 3 + 4 + 5也是对的,且有6组数据也是和之前分析是对的。
ohlc函数
在金融领域经常关系开盘、收盘和最高最低价,resample数据后可以进行这样的操作,pandas数据经resample后可以调用嗯ohlc函数得到汇总数据。
import numpy as np
import pandas as pd

v = np.arange(1, 21)
tx = pd.Series(v)
tx.index = pd.date_range('2018-12-01', periods = 20, freq = "d")
print "tx", "-" * 20, "\n", tx
tf = tx.resample("4d", closed = "right", label = "right").ohlc()
print "tf closed = 'right' label = 'right'", "-" * 0, "\n",tf
程序执行结果:
tx --------------------
2018-12-01     1
2018-12-02     2
....<省略>....
2018-12-19    19
2018-12-20    20
Freq: D, dtype: int64
tf closed = 'right' label = 'right'
            open  high  low  close
2018-12-01     1     1    1      1
2018-12-05     2     5    2      5
2018-12-09     6     9    6      9
2018-12-13    10    13   10     13
2018-12-17    14    17   14     17
2018-12-21    18    20   18     20
39.2 upsampling上(升)采样处理
低频变高频会出现大量的NaN数据,可以用method指定填充数据的方式。
import numpy as np
import pandas as pd
v = np.arange(1, 21)
#print v
t0 = pd.Series(v, index = pd.date_range('2018-12-01', periods = 20))
#print t0
print "first", "*" * 22
print t0.resample("6H").first()[:10]
print "bfill", "*" * 22
print t0.resample("6H").bfill()[:10]
print "ffill", "*" * 22
print t0.resample("6H").ffill()[:10]
print "interpolate", "*" * 16
print t0.resample("6H").interpolate()[:10]
程序执行结果如下:
first **********************
2018-12-01 00:00:00    1.0
2018-12-01 06:00:00    NaN
2018-12-01 12:00:00    NaN
2018-12-01 18:00:00    NaN
2018-12-02 00:00:00    2.0
2018-12-02 06:00:00    NaN
2018-12-02 12:00:00    NaN
2018-12-02 18:00:00    NaN
2018-12-03 00:00:00    3.0
2018-12-03 06:00:00    NaN
Freq: 6H, dtype: float64
bfill **********************
2018-12-01 00:00:00    1
2018-12-01 06:00:00    2
2018-12-01 12:00:00    2
2018-12-01 18:00:00    2
2018-12-02 00:00:00    2
2018-12-02 06:00:00    3
2018-12-02 12:00:00    3
2018-12-02 18:00:00    3
2018-12-03 00:00:00    3
2018-12-03 06:00:00    4
Freq: 6H, dtype: int32
ffill **********************
2018-12-01 00:00:00    1
2018-12-01 06:00:00    1
2018-12-01 12:00:00    1
2018-12-01 18:00:00    1
2018-12-02 00:00:00    2
2018-12-02 06:00:00    2
2018-12-02 12:00:00    2
2018-12-02 18:00:00    2
2018-12-03 00:00:00    3
2018-12-03 06:00:00    3
Freq: 6H, dtype: int32
interpolate ****************
2018-12-01 00:00:00    1.00
2018-12-01 06:00:00    1.25
2018-12-01 12:00:00    1.50
2018-12-01 18:00:00    1.75
2018-12-02 00:00:00    2.00
2018-12-02 06:00:00    2.25
2018-12-02 12:00:00    2.50
2018-12-02 18:00:00    2.75
2018-12-03 00:00:00    3.00
2018-12-03 06:00:00    3.25
Freq: 6H, dtype: float64